The Performance Management Eye Chart (bottom-up assessment) will pinpoint who among the front-line managers is performing exceptionally and who is not. Furthermore, it will show how front-line leaders compare to one another in your organization, their healthcare peers, and national averages.
The Talent Management Eye Chart (top-down assessment) will identify the talent of managers as perceived by their superiors. Further, it will provide you with a table and graph that show the odds of success of a particular department in relation to a manager’s performance, talent, and the department’s Degree of Difficulty (DoD).
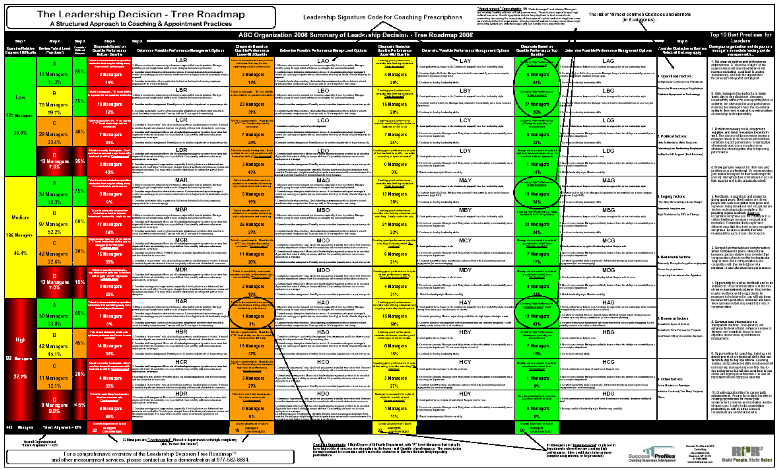
The next step is to create a customized Leadership Decision-Tree Roadmap, which will enable you to generate specific prescriptions for improving the performance of each manager. The Leadership Decision-Tree Roadmap is indeed the culminating point of the HPS Leadership Performance and Talent Management process. Through extensive analysis of thousands of leaders and front-line managers, we have created a predictive index guide that will calculate the expected odds of success of a particular leader based upon their overall talent level and the Degree of Difficulty (DoD) of the department they are assigned to lead.
At the macro level, the leadership success chart illustrates that there are three zones of performance alignment:
- · In the ‘High Success Zone’ representing excellent talent alignment, we see that “A” level leaders are successful in creating high performance in most cases. The odds of success being 85% when assigned to low degree of difficulty departments, 75% for medium DoD and 65% for high DoD. We also see that “B” level talent reflects relatively healthy odds of success. Approximately 75% of the time when assigned departments with low Dod and 60% when responsible for medium complexity departments.
- · At the other end of the performance continuum (the unlikely success zone), we see that “D” level leaders are rarely successful. The Odds of Success being only 25% for low degree of difficulty, 15% for medium and only 5% for high DoD departments. Note that this zone also includes “C” level leaders that are assigned to medium DoD and high DoD departments (with Odds of Success typically below 30%).
- · The final zone of possible success is located within the center of the chart: Here, we estimate that “B” level leaders have only a 45% Odds of Success in high DoD roles and “C” level leaders have approximately a 40% odds of success in low DoD roles.
Keep in mind that we’re not saying that it’s impossible for lower performing leaders within unlikely success zones to be successful. What we are suggesting is that you should avoid appointments where leaders are set up to fail because they may be in over their heads.
We find that the average healthcare organization only gets the right leaders in the right roles approximately 55% to 60% of the time. We also find that the best executive teams measured to date match the right leadership talent with the appropriate complexity more than 75% of the time.
We feel that this evidence clearly illustrates that leadership is the ultimate lever in creating consistently high performance.
Finally, the Leadership Decision-Tree Roadmap connects to an action planning coaching tool that allows for determining the best prescriptions for improvement based upon all the inputs of performance data. Every leader and manager within the organization can receive a personalized coaching plan that helps them improve their leadership style, identifies obstacles and barriers that can impede performance and enhances the coaching relationship with their immediate supervisor.
This structured approach to leadership performance and talent management contains 48 possible action planning combinations to provide assistance one leader at a time – one department at a time.
We have found that the unsustainable business model that healthcare organizations face, with limited resources to really invest in professional development creates a situation where HR executives will be more successful incorporating a strategy of leadership appointment over leadership development
The performance of front-line managers highly correlates to employee satisfaction, patient satisfaction, and other performance measures. Improving the performance of front-line managers is the single most effective lever to increase your organization’s net operating margin. A process to get the right leaders in the right roles may stack the Odds of Success in your favor better than any other strategy.
To view a Leadership Decision-Tree Roadmap sample (PDF) click here: LDT
Request a Customized Webinar or Phone Presentation - Request a Proposal - About Us - Home Page
Copyright (c) RPR2 and Success Profiles, Inc - All Rights Reserved


LEADERSHIP DECISION ROADMAP ::