Request a Customized Webinar or Phone Presentation - Request a Proposal - About Us - Home Page
Copyright (c) RPR2 and Success Profiles, Inc - All Rights Reserved
If there were a way to pinpoint with GPS-like accuracy who among your front-line managers is performing exceptionally and who is highly ineffective, would you want to know? If you did, what would you do about it?
With the performance of front-line managers highly correlating to employee satisfaction, patient satisfaction, and even the net operating margin, this knowledge is crucial. But are you getting correct information with your current performance appraisals? Do you have in place a talent management system that customizes improvement practices to the needs of each manager? And perhaps more importantly, DO YOU KNOW WITH CERTAINTY WHICH MANAGERS ARE IN THE WRONG ROLE AND WHICH SHOULDN’T BE IN MANAGEMENT AT ALL?
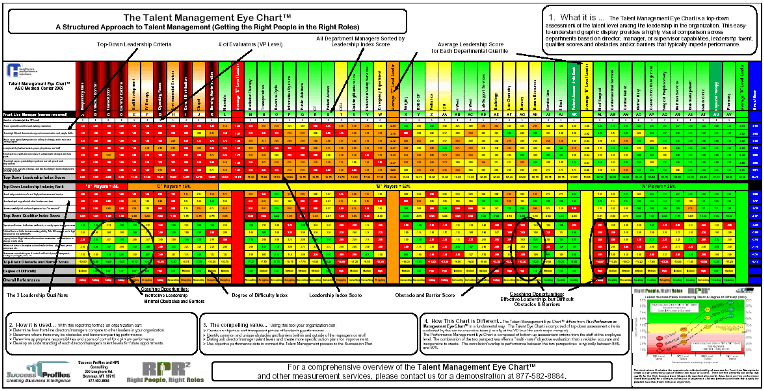
The Talent Management Eye Chart is a top-down, multi-rater assessment of the demonstrated leadership ability represented by every leader within the organization. This easy-to-interpret graphic display provides a large scale visual comparison across departments based on executive, director and front-line manager leadership talent.\
There are three sections illustrated on the Talent Management Eye Chart:
- The top section quantifies seven proven attributes of leadership
- The middle section evaluates leadership qualifications and
- The bottom section ranks the complexity, obstacles and barriers experienced in managing the department. This is known as the departments overall Degree of Difficulty – evaluated as either high medium or low.
When this version of the eye chart is completed, executives can determine which directors and managers are performing at the: “A” level, “B” level, “C” level, and “D” level.
At one end of the spectrum we can instantly observe which managers may be overleveraged (or in over their heads so to speak) due to their insufficient talent level to effectively manage the complexity within their span of control. At the other end of the chart, we can view which leaders are underleveraged (or the organization’s most talented leaders) that could effectively manage increased leadership responsibility.
The combination of the top-down and bottom-up Eye Chart tools offer an “objective ‘multi-rater’ evaluation” that is reliable, accurate and inexpensive. The correlation or overlap to performance between the two perspectives is typically between 75% and 85%.
To get the Talent Management Eye Chart Brochure (PDF) click here: Brochure
To view a Talent Management Eye Chart sample(PDF) click here: TM Eye Chart


TALENT EYE CHART ::